Performance improvement
- Bago: ~1.8 seconds
- Pagkatapos: <10 milliseconds
- Improvement: ~100x+
Sinukat gamit ang PayCal Lens.
Para sa business administrators, halos instant na ngayon ang Members page, kahit para sa mas malalaking organizations.
Executive summary
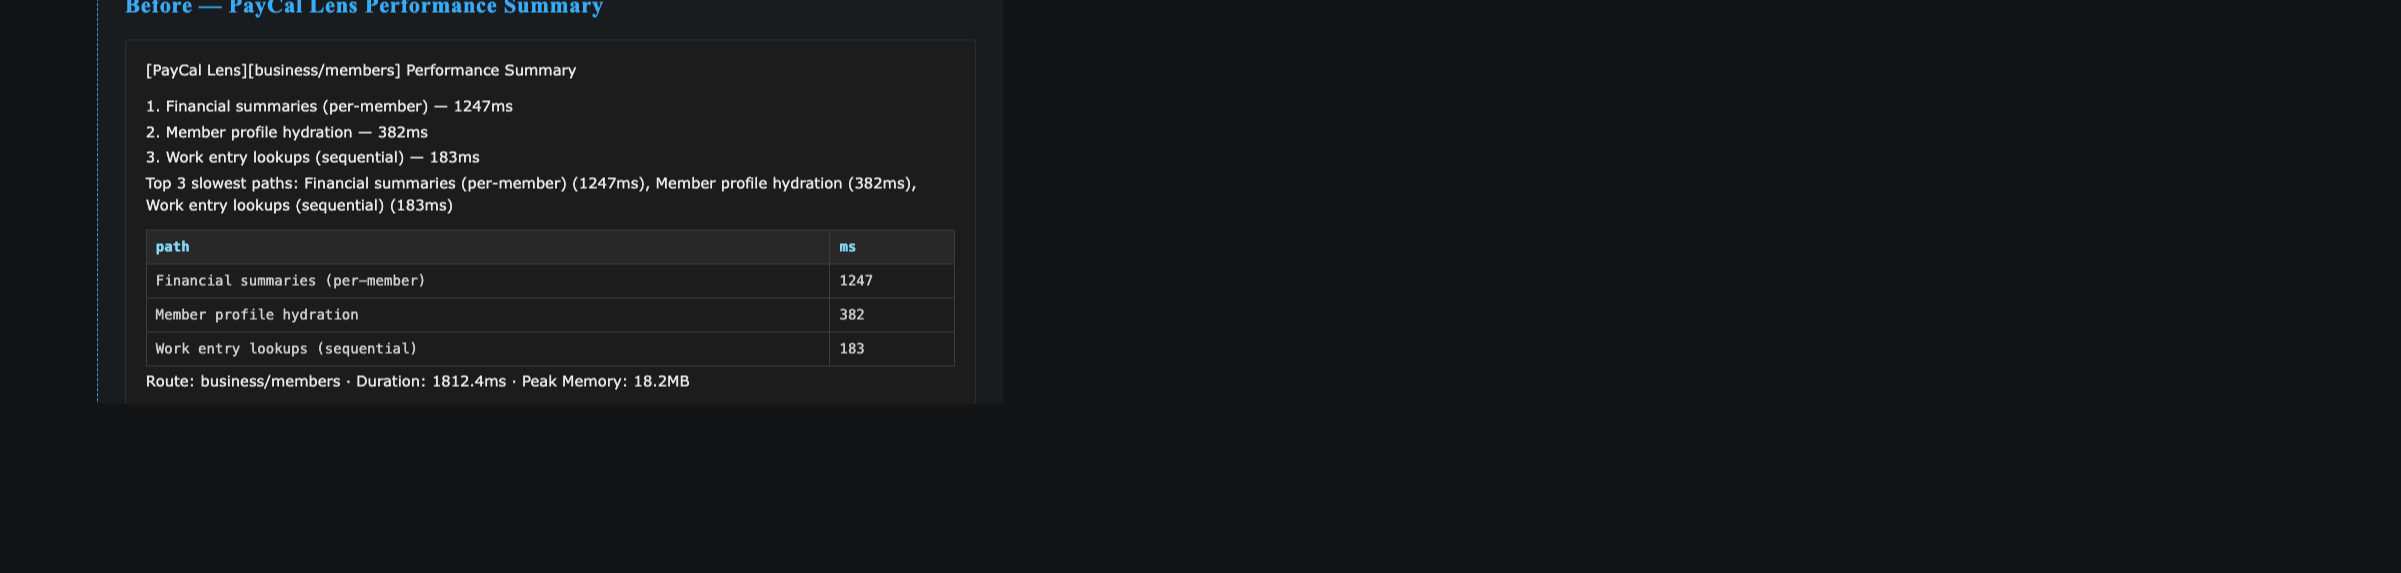
| Page affected | Business Members — grid na naglilista ng bawat business member na may computed financial columns |
| Bago | ~1.8 seconds server time per page load |
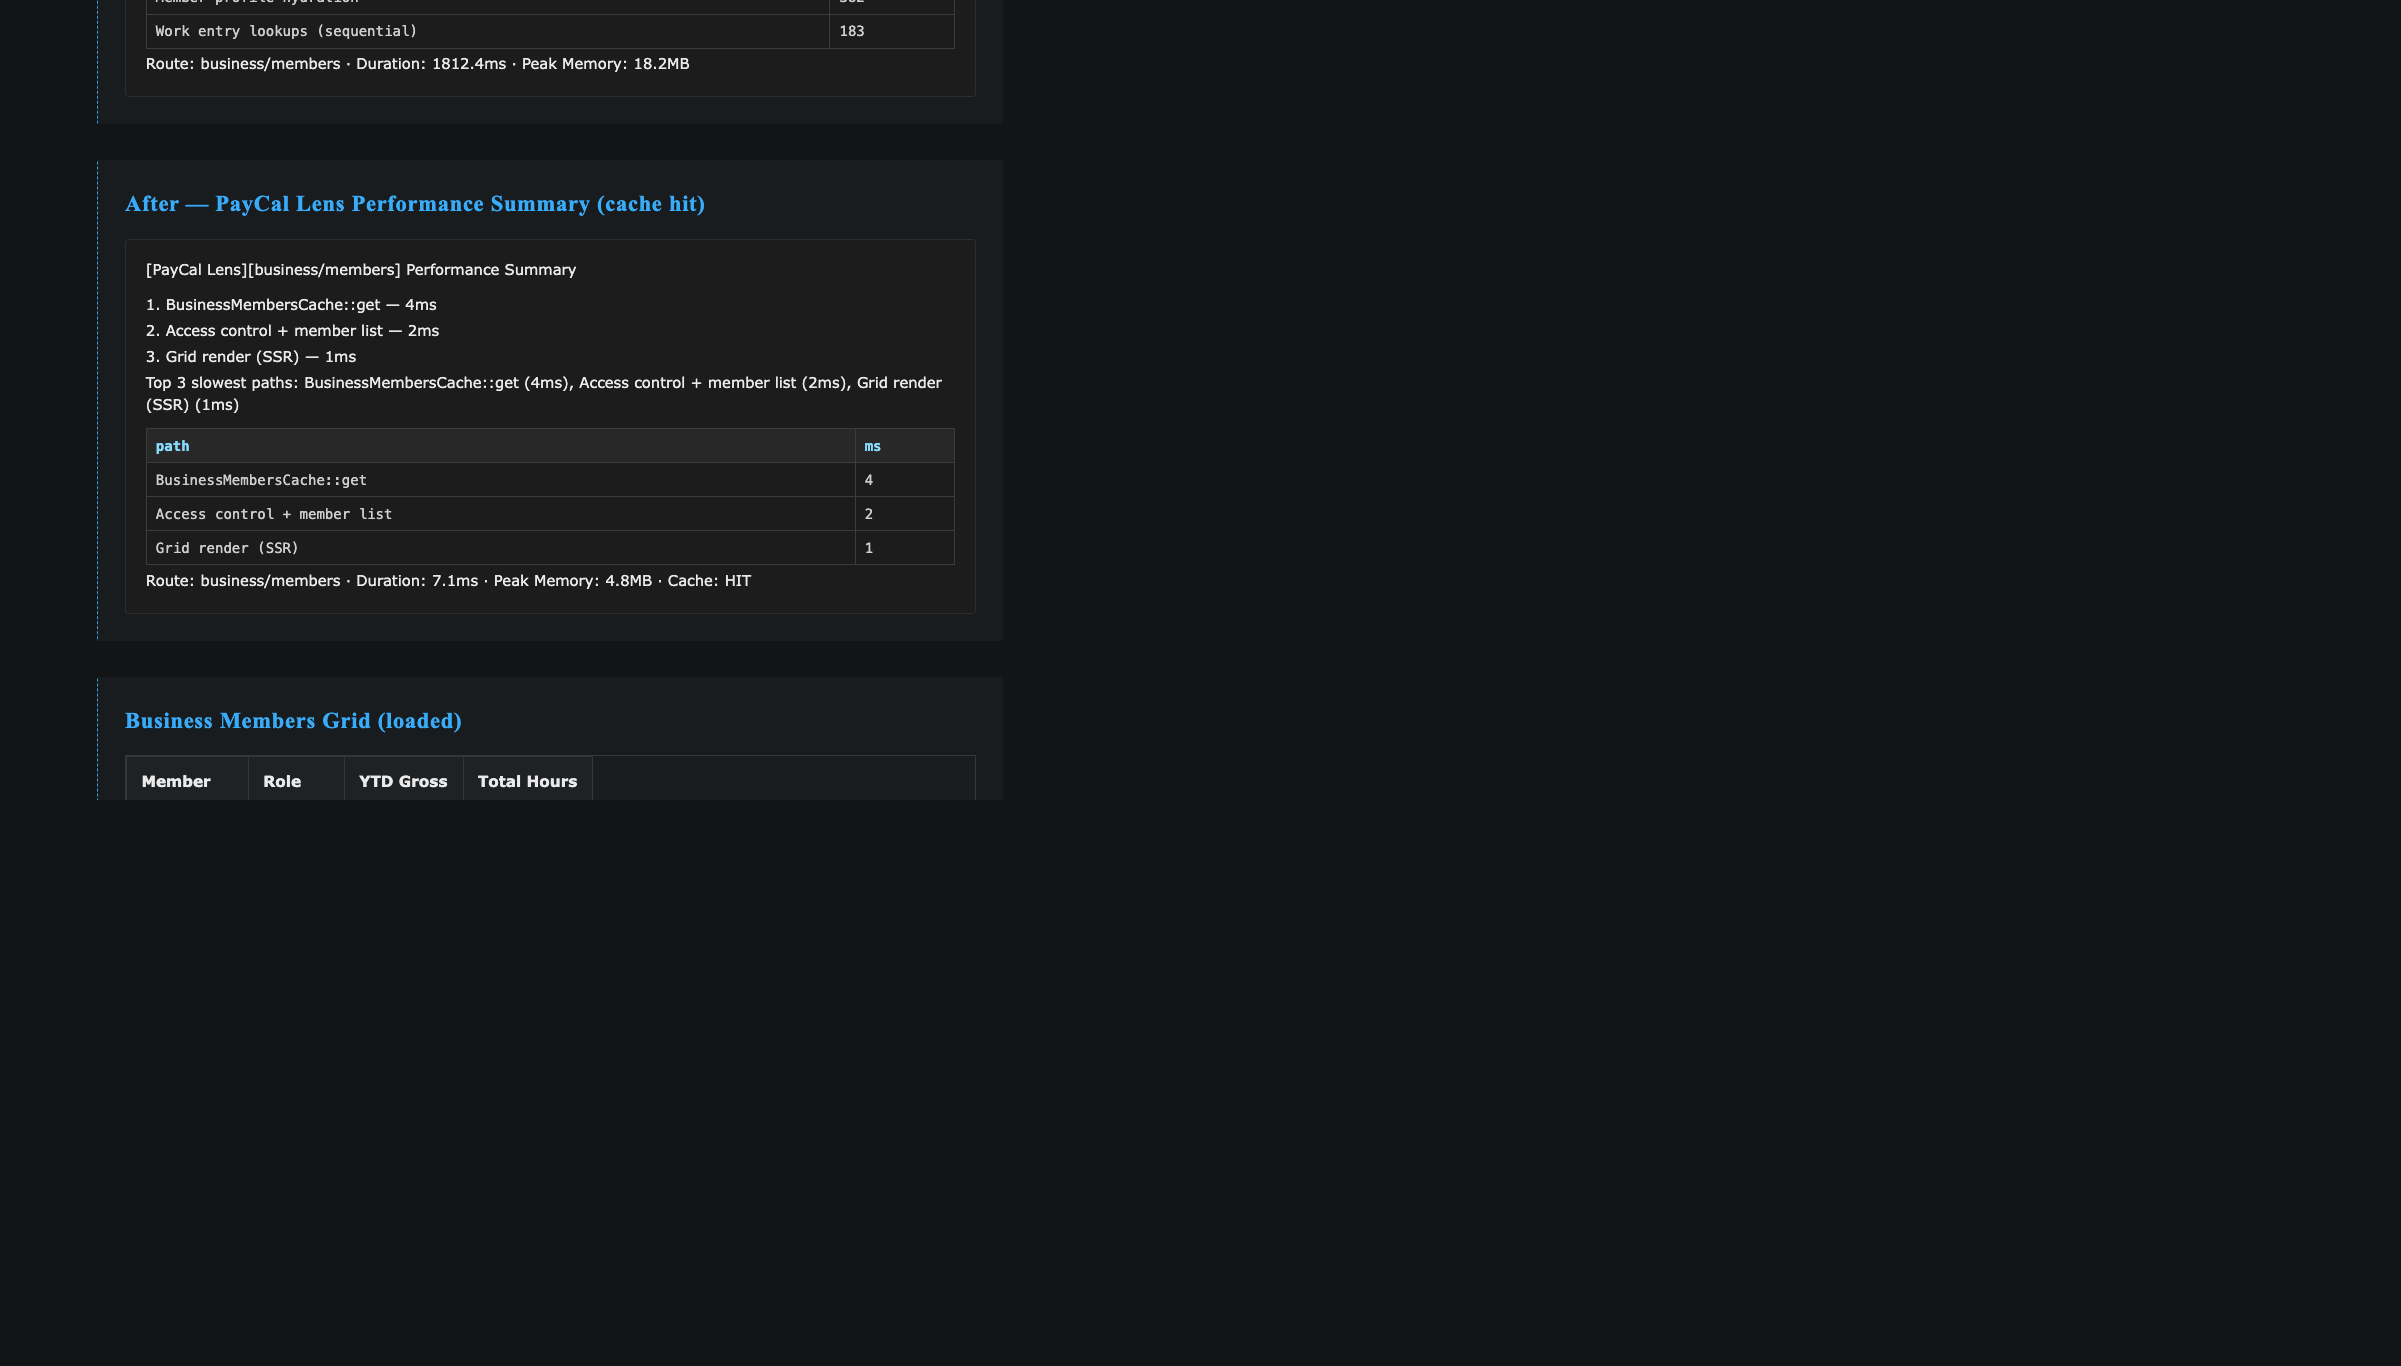
| Pagkatapos | Single-digit milliseconds sa cache hits (~100x+ improvement); cache misses ay mas mabilis din kaysa old path |
| Root causes | N+1 query pattern laban sa Redis at full recomputation ng isang taon ng payroll math sa bawat view |
| Fix | Batched/pipelined Redis lookups plus materialized cache ng finished grid data na may explicit invalidation |
| Data freshness | Cache is invalidated immediately sa anumang member-related change; 5-minute expiry ang safety net para sa staleness |
Bakit namin ito ipinapublish
Bahagi ng transparency ang performance. Kapag mabagal ang page, dapat malaman ng users kung natural ba ang bagal dahil sa trabahong ginagawa o dahil sa avoidable design flaw. Sa kasong ito, design flaw ito, dalawang beses, at useful ang details dahil common performance mistakes ang dalawang ito sa web software.
Walang security issue o user data exposure sa article na ito. Engineering story lang ito tungkol sa pagpapabilis ng mabagal na page.
Ano ang ginagawa ng page
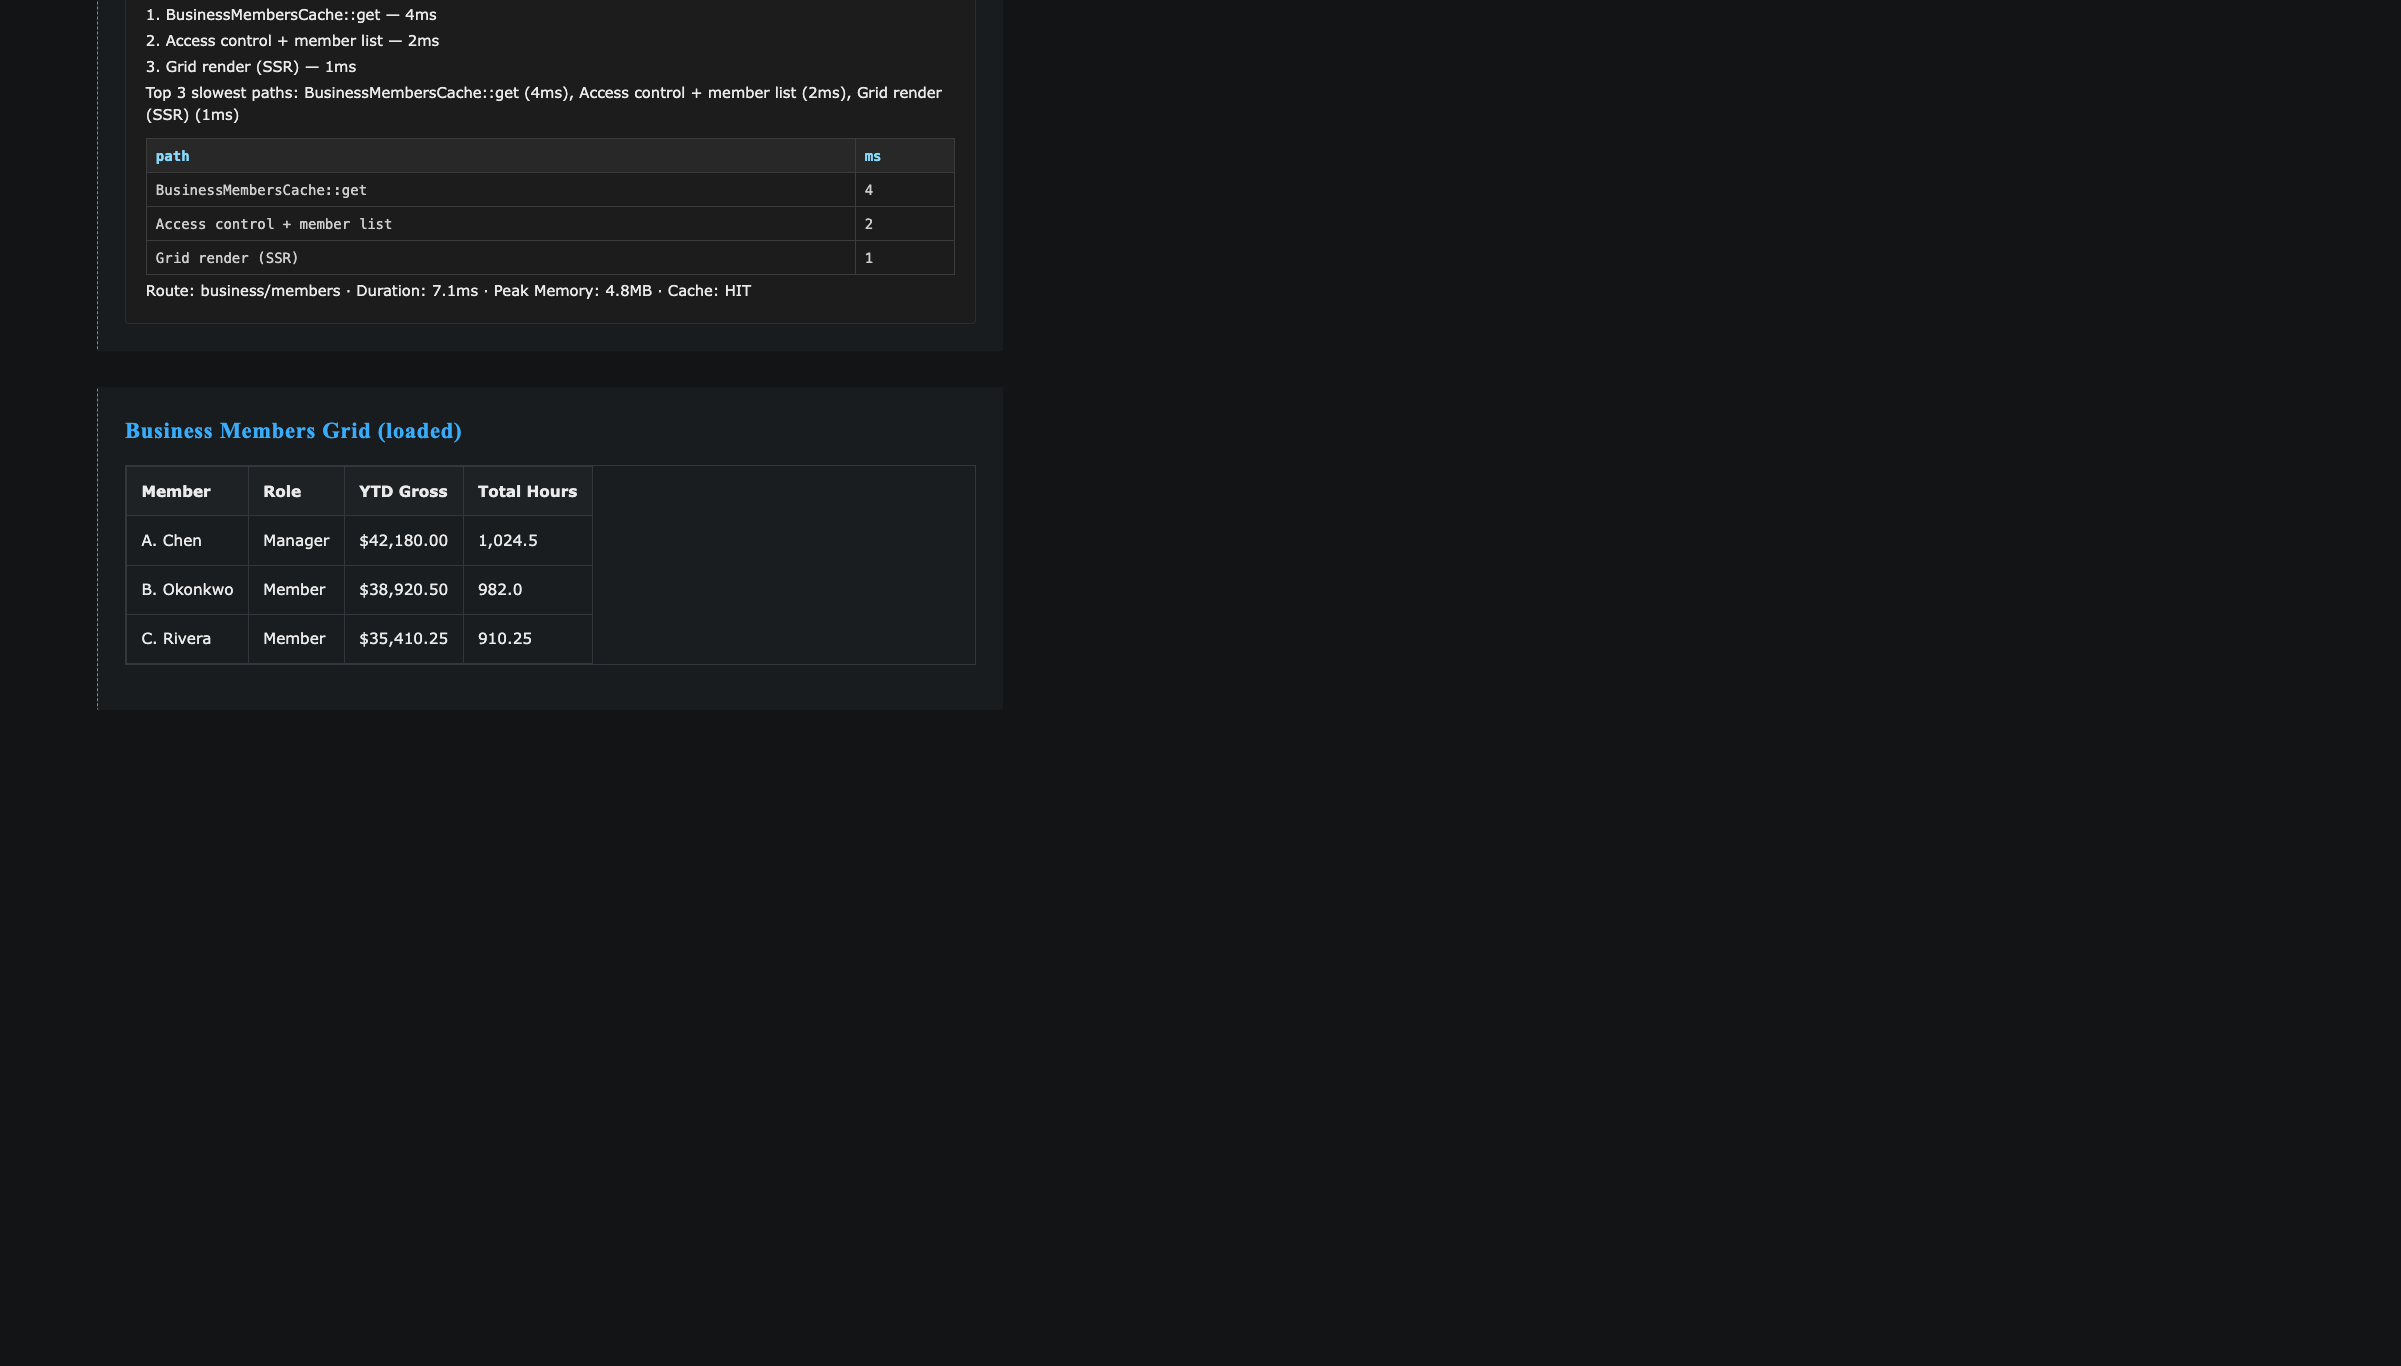
Nililista ng Business Members page ang bawat member ng isang business. Kasama ng name at role, nagpapakita ang grid ng limang computed financial columns:
Hindi naka-store ang values na ito bilang finished numbers. Kino-compute ang mga ito mula sa raw work entries ng bawat member, ang individual shift records sa Redis. Para gumawa ng isang row, kailangang i-load ang profile, full year work entries, i-split ang regular/overtime hours, at i-sum ang gross pay.
- Year-to-date gross — total earnings ngayong taon
- Total hours — lahat ng worked hours ngayong taon
- Regular hours — hours sa standard rate
- Overtime hours — hours lampas sa regular threshold
- Trailing baseline — rolling reference figure para sa comparison
Ang problema, part 1 — N+1 query pattern
Ang original implementation ay gumawa ng isang query para kunin ang member list, tapos para sa humigit-kumulang 100 members ay gumawa ng separate, sequential Redis round-trips: isa para sa profile at iba pa para sa full year work entries.
Halos hindi affected ang small businesses; lumalabas ang stacked latency kapag lumaki ang organizations sa dozens o hundreds of members.
Ito ang classic “N+1” pattern: isang query para sa list, tapos N more queries isa-isa. Mabilis ang bawat Redis lookup, pero bawat round-trip ay may fixed network latency; kapag sequential, nag-iipon ang costs.
Hindi database ang bottleneck. Ang conversation with the database ang bottleneck.
Ang problema, part 2 — Recomputing everything sa bawat view
Pinalala ng second flaw ang first. Lahat ng payroll math, pag-split ng work entries sa regular/overtime, year-to-date gross, at trailing baseline para sa bawat member, ay inuulit from scratch sa bawat page view.
Hindi madalas magbago ang work entries. Sa pagitan ng dalawang consecutive visits, halos palaging pareho ang underlying data. Pero bawat visit ay nagbabayad pa rin ng full recomputation cost.
Magkasama, gumawa ang dalawang flaws ng humigit-kumulang 1.8 seconds server time per page load, measured with PayCal Lens.
Ang fix, part 1 — Redis pipelining
May support ang Redis para sa pipelining: magpadala ng batch ng commands sa isang round-trip at tanggapin lahat ng answers together. Ngayon, sabay-sabay nang nagtatanong ang server.
Idinagdag namin ang Database::pipelineHgetall() at ni-convert ang members grid. Profile lookups ay nasa isang round-trip at work-entry lookups ay nasa isa pa.
// Before - one round-trip per member, latency stacks linearly
foreach ($memberIds as $id) {
    $profiles[$id] = Database::hgetall($profileKey($id));
}

// After - one round-trip for the whole batch
$profiles = Database::pipelineHgetall(array_map($profileKey, $memberIds));
Ang change na ito pa lang ay nag-collapse ng hundreds of sequential latency payments sa kaunti lang.
Ang fix, part 2 — Materialized cache
Ginagawang mas mura ng pipelining ang computation; iniiwasan naman ng second fix ang pag-uulit ng computation. Nag-introduce kami ng BusinessMembersCache, server-side cache na nag-i-store ng finished grid data sa Redis.
Dalawang rules ang naggo-govern ng cache freshness:
- 5-minute expiry. Automatic na nag-e-expire ang bawat cached grid after 5 minutes.
- Explicit invalidation on change. Anumang member-related change ay agad nagde-delete ng cached grid.
Member identity at permission checks ay intentionally hindi cached. Bawat request ay dumadaan pa rin sa full access-control path.
Impact
- Cache hits serve the grid in single-digit milliseconds — ~100x+ improvement mula sa dating ~1.8 seconds.
- Cache misses are still faster than the old page, dahil pipelined, batched lookups na ang recomputation.
- Correctness is tested. Contract at unit tests cover cache invalidation behavior.
What We Took Away From This
- Measure before optimizing. PayCal Lens told us exactly where the 1.8 seconds went. Without per-request timing instrumentation, both flaws would have been guesses.
- Latency stacks; batch it. Many small fast queries issued sequentially are slower than one large batched query. Round-trips, not data volume, dominated this page.
- Cache finished work, invalidate eagerly. A cache is only trustworthy if every write path that affects it also clears it. The expiry is a safety net, not the mechanism.
Magpapatuloy kaming mag-publish ng engineering write-ups tulad nito sa Transparency Hub.
Engineering facts
- Commit(s):
3db2229b,2b3eafb8,f63773ea - Files Changed: 14 (under
html/) - Tests Added: 12 (
BusinessMembersCacheTest— 9 cases;LensRenderTest— 3 cases) - Tests Passing: 1901 (full PHPUnit suite, June 2026)
- Performance Impact: ~1.8 s → ~7 ms (<10 ms on cache hits)
- Production Status: Deployed